Regardless of who your target audience is, visuals can make it much easier to keep their attention.
Including images or videos in your blog posts can boost engagement and convert more leads into customers. However, visuals are useful for more than just blogging. Including images and videos in your coaching program can also make it easier to communicate with clients and customers.
Visuals make it easy for us to remember. When you’re presenting information, facts, or instructions to your coaching clients, using graphs, images, or even bullet points can make it easier for them to absorb the information. In fact, visuals can improve memory by 32%.
Appealing to Different Learning Styles in Coaching
People learn in a number of different ways. While some of us, known as the auditory learners, do better when hearing instructions, visual-linguistic learners prefer to see their instructions written out. Yet another group, the visual-spatial learners, learn best when given charts, images, or videos to work from.
When it comes to coaching, both auditory and visual-linguistic learners can learn relatively easily. With things like coaching calls, webinars, and articles, both auditory and visual-linguistic learners tend to pick up on information rather easily.
Unfortunately, visual-spatial learners tend to get left out. When infographics, videos, and images aren’t easy to create, coaches often ignore them in favor of a different way to represent their information. However, in order to ensure those visual-spatial learners don’t get left behind, you need to find ways to easily include some visuals into your content.
Want to see the types of designs we do for coaching businesses like yours? Check out the samples in our Design Portfolio.
Communicating Through Visuals
It isn’t difficult to include more visuals into your coaching program. While it may take some additional time to create high-quality visuals that your target audience will want to engage with, adding just a few more minutes to your content creation can have a serious impact on the quality of leads engaging with you.
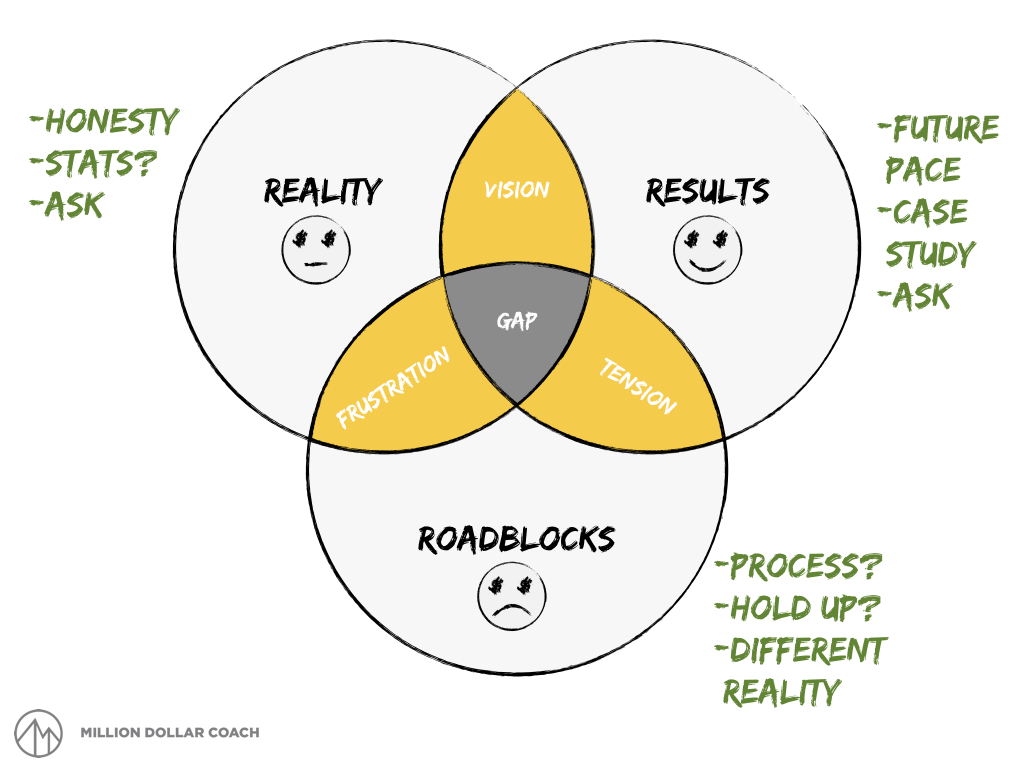
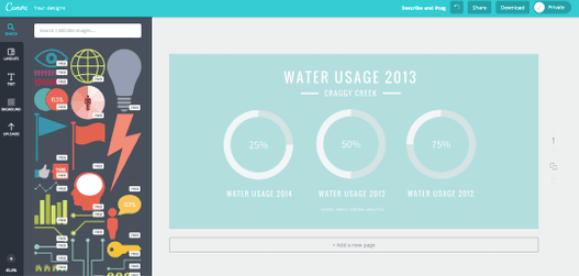
You can use visuals to explain certain concepts that may be challenging to describe in just words. Venn diagrams are an easy visual to create but can have a high impact on your clients and customers. Other visual aids, such as graphs or pie charts, can help your target audience better understand statistics you’d like to share.

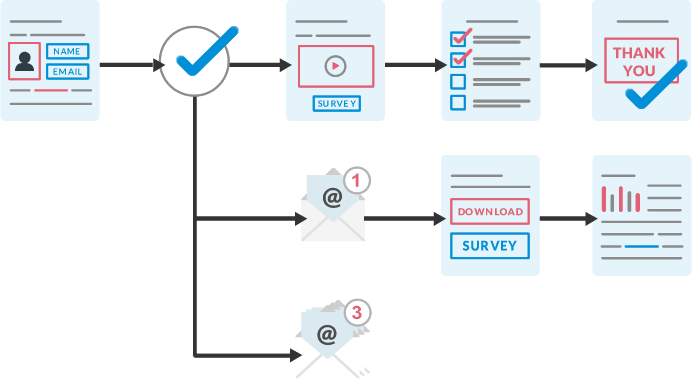
When trying to explain certain processes or systems, use checklists or funnels rather than simply explaining it in words. Listing out each step in a clear process can help visual learners understand how each piece flows into the next. Checklists and funnels also make for great resources that your clients can refer back to when they need a refresher.
Finally, another simple way to add visuals to your content is through screenshots, examples, and markups. If you’re trying to explain to your clients how to accomplish a specific task, you can add screenshots to walk them through the process and make it easier for them to understand exactly what steps to take.
Great Tools for Powerful Visuals
Many coaches are under the impression that they can’t create awesome visuals without spending loads of cash. However, you don’t need to be an expert graphic designer to create visual aids that can help your target audience learn.
Here are some of the best tools on the market for creating visuals – without breaking the bank:
Canva: Canva is a free tool that allows you to create everything from infographics to blog headers.

Draw.io: Draw.io allows you to create flowcharts to explain ideas, concepts, or processes.
Keynote/PowerPoint: Keynote or PowerPoint can both help you design slideshows that feature graphs, charts, and more to help your visual clients better understand principles and ideas.
Funnelytics: Funnelytics’ main focus is on creating funnels. Through customizable funnel mapping, you can lay out processes and flow charts for clients.

Mindmup: Mindmup is an easy way to create mind maps. These mind maps can show a flow of ideas and help clients better understand how things connect.
Skitch: Skitch is an extension of Evernote. With Skitch, you can create sketches, add shapes, or use annotation to help create a more visual representation of your notes and ideas.
Get Custom Visuals With Automation Agency
Creating great visuals can be time-consuming. If you simply don’t have the time or eye for design to create visuals you and your clients are happy with, outsourcing content creation can save you time and help you get higher returns.
Working with Automation Agency can help you create high-quality infographics, blog headers, graphs, or other visuals you can use within your coaching business. By hiring our professional team to tackle all your visual needs, you can ensure none of your clients are getting left behind because you simply don’t have the time to create what they need.
If you’re an Automation Agency client, simply send in the design task you’re looking for and we’ll get started.
And if you’re not yet a client but you’re interested in seeing the types of designs we do for coaching businesses like yours, check out the samples in our Design Portfolio.


